 The Right Stock At The Right Time®
| The Right Stock At The Right Time® |
|
||
|
The MACD Boys
MACD (Moving Average Convergence Divergence), developed by Gerald Appel utilizes various exponential moving averages of a stock's closing price to generate buy and sell signals. Exponential moving averages (EMA) assign greater weight to the most recent price data and therefore are more sensitive than simple moving averages. The standard MACD short-term indicator (MACD-ST) consists of the differential line and the signal line. The differential line is constructed by measuring the difference between two exponential moving averages, a 12 and 26 day time period. The signal line is a 9-day EMA of the differential line. When the deferential line crosses the signal line from below, a buy signal is produced. Conversely, when the differential line crosses the signal line from above, a sell signal is formulated.
MACD-ST is a good indicator for spotting short-term trend reversals however it can be subject to many whipsaws. In order to smooth out the signals and for a longer-term approach, Market Edge developed a MACD long-term indicator (MACD-LT) whose differential line and signal line consists of EMA 's with significantly longer time frames. The MACD-LT buy signals are very good at identifying entry points for long positions. However, the sell signals are not as strong. Better to use a different method such as targets or sell stops to exit long positions.
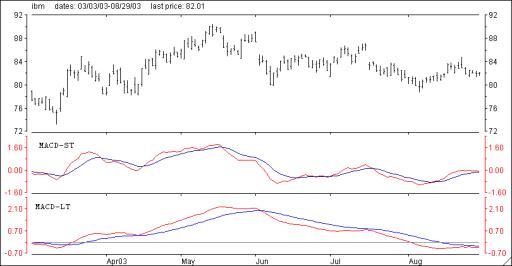
Below is a six month chart of IBM from 3/1/03 - 9/1/03. The first graph under the chart is MACD-ST. The second graph is the MACD-LT. Notice the frequent number of crosses generated by MACD-ST versus those from the MACD-LT indicator.
 Both of the MACD indicators are located on the Market Edge 'Second Opinion' page and are included in the 'Smart Chart' feature. They are designated as either BL (bullish) or BR (bearish) on the Second Opinion report. In addition MACD-LT is one of the components of the Power Rating, which generates the Long, Neutral and Avoid 'Opinions'. |